Timberline Article: New Statistical Process to Control Lumber Drying
Finding the ‘Sweet Spot’ in Lumber Drying: Wagner Electronics Offers New Statistical Process Control Methodology for Building Profits
Wagner Electronics – ‘Sweet Spot’ Statistical Process Control for Kiln-Dried Lumber
By Tim Duncan
Date Posted: 7/1/2009
(Publisher’s Note: Versions of control charts are used in some lumber manufacturing processes and companies. Certainly, moisture content decisions of some kind have to be made on every dry kiln charge. Ed Wagner and his staff at Wagner Electronics are excited about the new statistical concept they have developed for making moisture content decisions on kiln charges. This is the first editorial on their new ‘sweet spot’ statistical control methodology.)
Introduction to SPC Methods
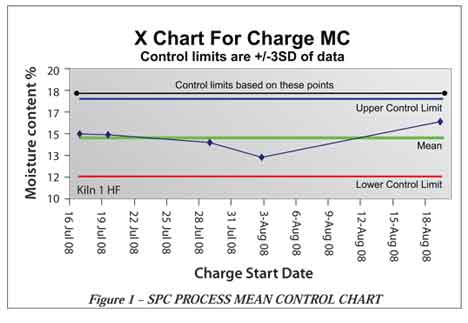
Kiln drying operations are fraught with issues in terms of maintaining consistency to minimize de-grade. Planer superintendents, QC personnel, and Kiln operators all go back and forth trying to deal with issues in an attempt to stay on top of their drying processes. Statistical process control (SPC) methods are often employed to control a manufacturing process. Using SPC methods, the “process mean” is determined by taking sample averages and determining the standard deviation, an accepted measure of variation or dispersion. Then a “control” plot is created that has the “process mean” identified with upper and lower control limits, three standard deviations above and below the process mean. Future sample averages are then plotted on the control chart to determine whether the process is in control, out of control, or drifting out of control. Figure 1 depicts a typical SPC Process Mean Control Chart. Using the average moisture content (MC) for a charge of lumber will be shown to lead to improper analysis and resultant decisions leading to lumber value loss through excessive de-grade. A more appropriate method for performing SPC, that was developed by Wagner Electronics in conjunction with several forest products university faculty, will be shown to provide the basis for maximizing lumber value in kiln drying operations and processes.
Problems of ‘Average’ Moisture Content
First, it is helpful to review why a sampling to determine an average is usually used in SPC control methods. One samples a population distribution to estimate the “central tendency” or average for the sampled population. The “central tendency” is defined as what the most likely result will be the next single item measured from the population. For example, a sawmill measures the average moisture content of a kiln charge. There are very few samples from a population that actually measure the exact “central tendency”. Rather, the “central tendency” is the value that most samples “reside” about. In a normal population distribution, often called a “bell-shaped curve,” the central tendency is equal to the mean average. The probability distribution around the average is symmetrical and shows a balanced shape. For a normal distribution, the average is also the median, the point that splits the population in two with 50% of the population below it and the other 50% above it.
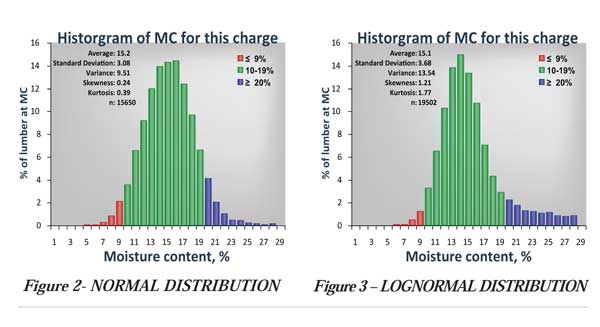
One major problem contributing to improper kiln drying processes is that a population of board moisture content levels is rarely a normal population distribution as indicated in Figure 2. Often times, it is more of a lognormal distribution, which is skewed to either the left or the right. On some occasions, it might have a bi-modal distribution with two high points. Some species such as Douglas Fir and Hemlock often have a “tail” of wets. The lognormal shape of a distribution is attributed to the fact that lumber drying is proportional to the difference of the current MC value minus the equilibrium moisture content (EMC) of the kiln. So, as the boards are dried down closer to the EMC, the rate of drying decreases for these boards. This leads to a “grouping” together on the dry end and a dispersing “tail” on the wet end as indicated in Figure 3.
While many mills implement some sort of statistical process control and monitoring in the sawmill area, many still lack similar tools for their kiln drying processes. What usually occurs is that for each charge of lumber an average of samples is taken. Along with the standard deviation of those samples, a decision is made as to whether the proper amount of drying has occurred. No control charting or analysis to determine whether the measurement resides within acceptable limits is typically performed. This usually means either some predetermined average MC target was realized, or it is decided that the charge was either over dried or under dried.
With a lognormal distribution, a calculated average will overestimate the true central tendency, so that the average may be 18% MC while the central tendency is actually 17% MC. Given this scenario, it is easy to understand why a decision may be made that would result in over-drying the next charge of lumber if for instance the “pull” criteria are modified based on this incorrect assumption on the “true” average of the charge. Suppose that the next time a more “normal” a distribution is appropriate. Now, the next charge will get over dried when the average is used, so the operator will again have to adjust the “pull” criteria to get back on track. This cyclic behavior has been called “chasing one’s tail”, referring to the dispersing moisture content tail on the upper end of the moisture content distribution for most lumber charges.
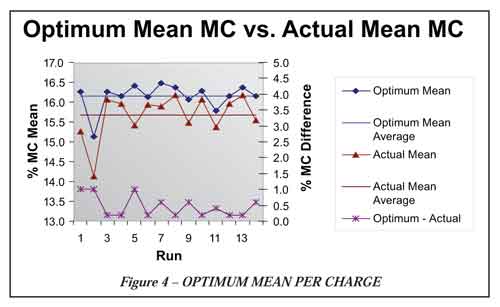
This leads to the fact that an “average” for one distribution is not necessarily equal to an “average” for another. To investigate the effect of this on lumber value and drying processes, we performed an analysis to compare the “optimum” lumber value for fourteen MC distributions that were gathered from run data at a mill using an inline moisture measurement system for 2X4 HemFir. Figure 4 shows the “average” measured that optimizes the lumber value. As can clearly be seen each distribution of MC data has a different average that would optimize the lumber value. Now it is impossible to “predict” what type of MC distribution will result from each charge of lumber being dried, so the astounding result is that trying to target a specific average MC as a “pull” target is at best an unreliable method. However, further looking at the graph, one can see that there is an “average” mean MC that would, on average, optimize the combined lumber charges over any short period of time (weeks). Using tools to calculate and determine the optimum average MC that maximizes the lumber value for a given number of consecutive charges (5 for example) and then calculating the average of those will allow one to target a more appropriate, optimized, “pull” target mean MC value. Averaging over multiple recent charges will diminish, if not eliminate, short-term charge to charge variability.
But there is a further complication in that the optimum mean MC pull target changes with seasonal variations and changes in log diets. So, if one is to use a target mean MC value for “pulling” a charge, one must be constantly looking for these long-term variances and adjust accordingly. The answer is to not track the resultant mean MC, but to track the optimum value against the actual value for each charge and to determine how much each charge was either over dried or under dried. By tracking this parameter, one can use this as their process mean in an SPC control chart. Seasonal log diet changes and other more long-term variability drifts will be readily evident in such a control chart. These charts will automatically provide the necessary information to feedback to the kiln operator for adjusting the “pull” target. This methodology is outlined in the following section.
Lumber Valuation with Business Analytics is Key
This leads to the question as to how one might perform this evaluation of overall charge lumber to determine whether a charge has been either over dried or under dried. The following describes a patent pending process jointly developed by Dr. Mike Milota of Oregon State University and Wagner Electronics during a recent year-long study in conjunction with four participating mill sites. Using an inline moisture measurement system, data is gathered and stored in the system database for later viewing and analyses. Using package and charge tagging schemes, the data is stored and segmented into separate charge information. To accurately determine the overall charge value, one would need to look at the grade out statistics for a charge of lumber. This becomes impractical in almost all cases as the grade information is almost always associated with another independent system. Also, under normal operations, charge packages of lumber are usually not processed through the grader in consecutive order. It is more often the case that packages from separate charges are processed randomly. The moisture measurement system can handle this randomness of packages quite well and store the data appropriately.

Free Download – How to Choose a Moisture Measurement System for Your Sawmill Buying Guide
There have been studies done that correlate the over-drying of lumber to grade loss. For instance, if 100 boards that are at 15%MC are graded and compared to 100 boards that are graded at 12%MC, one can associate the percent of value loss due to over-drying effects such as warp, twist, cup, bow, and checking. Once we know this statistical relationship, one can assign value loss on a statistical measure to individual board groupings based on %MC within a complete of lumber chares. It isn’t even necessary that the complete charge of lumber be measured for %MC, but only enough to give a significant statistical representation of the overall charge MC distribution.
Now the over-drying also needs to be offset by the value lost in under-drying boards. Some grading specifications call for an allowed statistical percentage of “wet” boards in a group that exceeds the maximum allowed %MC. This maximum allowed %MC is often referred to as the “wet” marker.
For those boards exceeding the wet marker and the allowed percentage of wets, they can be “devalued” by a number of methods. One method is where a mill has a re-dry operation as part of their overall drying process. In this case, wet boards are “dropped” out of the production line and re-stacked with a subsequent additional drying in a kiln. The cost of re-drying is very well known, so that cost is what is used to devalue that percentage for the charge. Knowing these valuation methods, one can now ascertain the overall value of a charge of lumber based on moisture content statistical distribution, without the need for specific grade out. This process where we assign value losses to a nominal lumber value based on %MC distribution of charge lumber using statistical evaluations, averaging to remove normal variability, and feeding back the amount of over-drying or under-drying occurring that would otherwise maximize the value of the lumber is a patent-pending process known as “Sweet Spot” Statistical Process Control with Advance Equipment Controller feedback for kiln drying lumber processes.
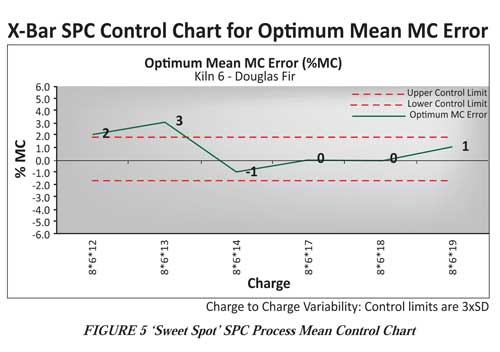
By using a charge valuation method to determine whether a charge was over-dried, under-dried, or dried to the exact “Sweet Spot”, this determination becomes the best foundation possible for performing statistical process control process mean charting. Figure 5 depicts just such a chart. Notice how the first two charges have been over-dried by two and three %MC respectively. Then note how the four following charges average to 0%MC optimum MC error. Ideally, every charge would be at 0%MC Error, but this isn’t a realistic expectation for the reasons outlined above due to short-term variability from charge to charge. However, one can see that for the most recent four charges, this mill’s kiln drying process is well in control and is achieving maximal lumber value.
What is so unique about this control chart is that the process mean is predefined to be 0%MC error, since this is the “Sweet Spot” that optimizes the value of the lumber. The process mean never has to be calculated or recalculated. The upper and lower control limits are determined by the standard deviation of how close the charges are dried to the “Sweet Spot”; typically limits of about +/- 1.5%MC is considered good. A charge that misses the “Sweet Spot” by 2%MC or more should be investigated to determine an assignable cause. Should the process be drifting as determined by the most recent four or five charges, the average offset of those charges should be fed back to the kiln operator, so the current “pull target” can be adjusted accordingly; this is the “advanced feedback control” that is allowed with this SPC methodology. These unique key features are what allowed for the application of and patent pending result for this overall SPC process based on “Sweet Spot” Technology.
How to Add Big Dollars to Your Bottom Line
Wagner Electronics is offering this new “Sweet Spot” technology as a service for its current and future softwood lumber mill customers. Ed Wagner said, “We believe that sweet spot technology can move conservatively 2% of a softwood mill’s revenue to its bottom line. Thus, a twenty million dollar a year softwood mill can expect an additional $400,000 of profit, if not more, when they effectively use our sweet spot technology.”
Mills can add profits from sweet spot technology by adjusting drying schedules based upon information that they previously did not have. In addition, improved MC information allows mills to make productive changes in their physical kilns and kiln operational processes. It has often been said that lumber drying is a tricky process, a combination of science and art.
Sweet spot technology gives a tool that helps a mill by providing information that previously was not available. Now a mill can make technical equipment modifications and on-going operational adjustments based on facts not previously known.
For more details on Wagner’s sweet spot technology and how to integrate it into your kiln drying processes, call Wagner at 541.582.0541 or go to wagnermeters.com.

Wagner Meters is a family-owned American business that aims to provide solutions in moisture measurement technology that will enhance the quality and value of each customer’s project. With an almost 60-year legacy of innovation, Wagner continues to be a resource for both individual craftsmen and high-performance commercial endeavors.
Last updated on June 7th, 2022